aabshar
Water saving · Water intelligence

THE WATER OPPORTUNITY

Water needs investment.
Smart systems need data.

Aabshar retrofits existing taps to cut water use. It is developing the measurement layer for smarter water decisions.
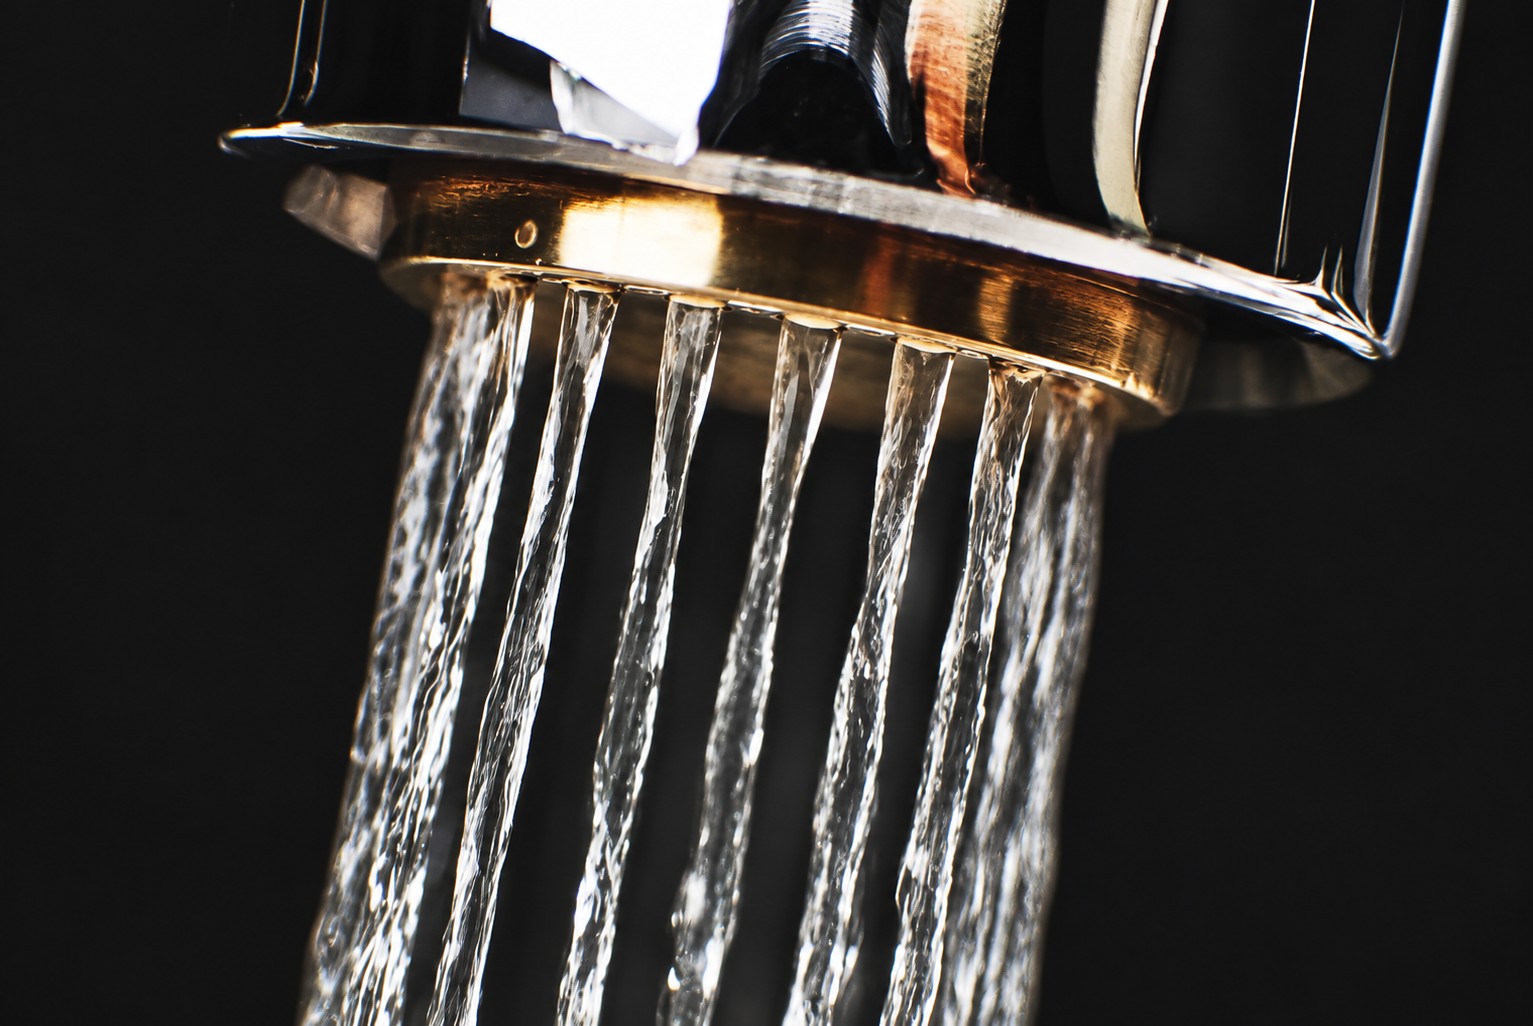
Close-up of water flowing through an Aabshar tap
GLOBAL WATER-SECURITY NEED$1T/yrinvestment required to reach water security by 2030
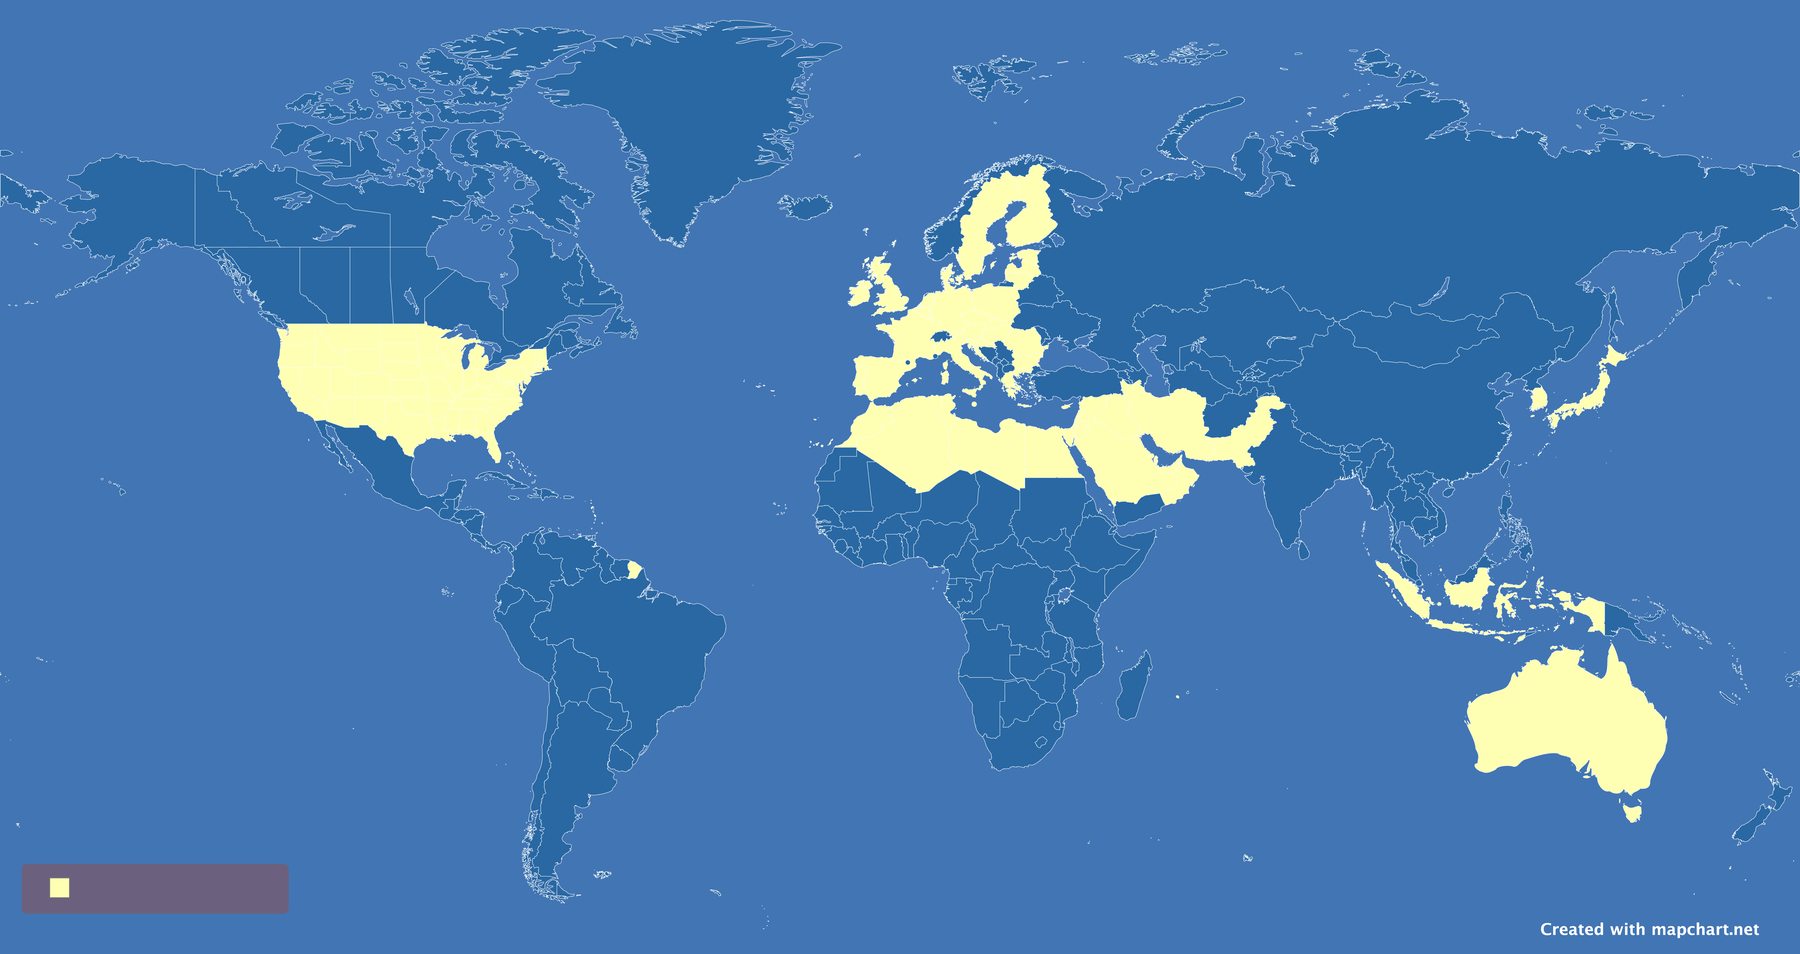
Illustrative map of a future smart-water network
SMART-WATER MANAGEMENT$43.7Bglobal market forecast for 2030
Where does Aabshar enter? At a tap that can be upgraded today

UNESCO WWDR 2026: roughly $300B invested and a $700B annual gap. BCC Research 2025: $43.7B 2030 category forecast. Neither figure is Aabshar’s addressable revenue; the map is illustrative.

02 / Customer problem

Three costs sit behind every running tap.

Water use, the energy needed to move it, and the missing data needed to manage it.

Water

01

Unnecessary flow

Fixtures waste water every day. Site operators need a retrofit that avoids major plumbing changes.

Energy

02

Pumping and heating

Higher water throughput can raise related electricity and operating costs. Savings must be measured site by site.

Visibility

03

Quality blind spots

UNEP identifies a major global water-quality data gap. The buyer opportunity depends on a deployable sensor and data service.

83%of people in the Middle East and North Africa are exposed to extremely high water stress.WRI Aqueduct, 2023 ↗

The regional stress figure describes exposure, not Aabshar’s potential customer base.

HARDWARE PROOF

Six litres becomes less than one in a one-minute tap test.

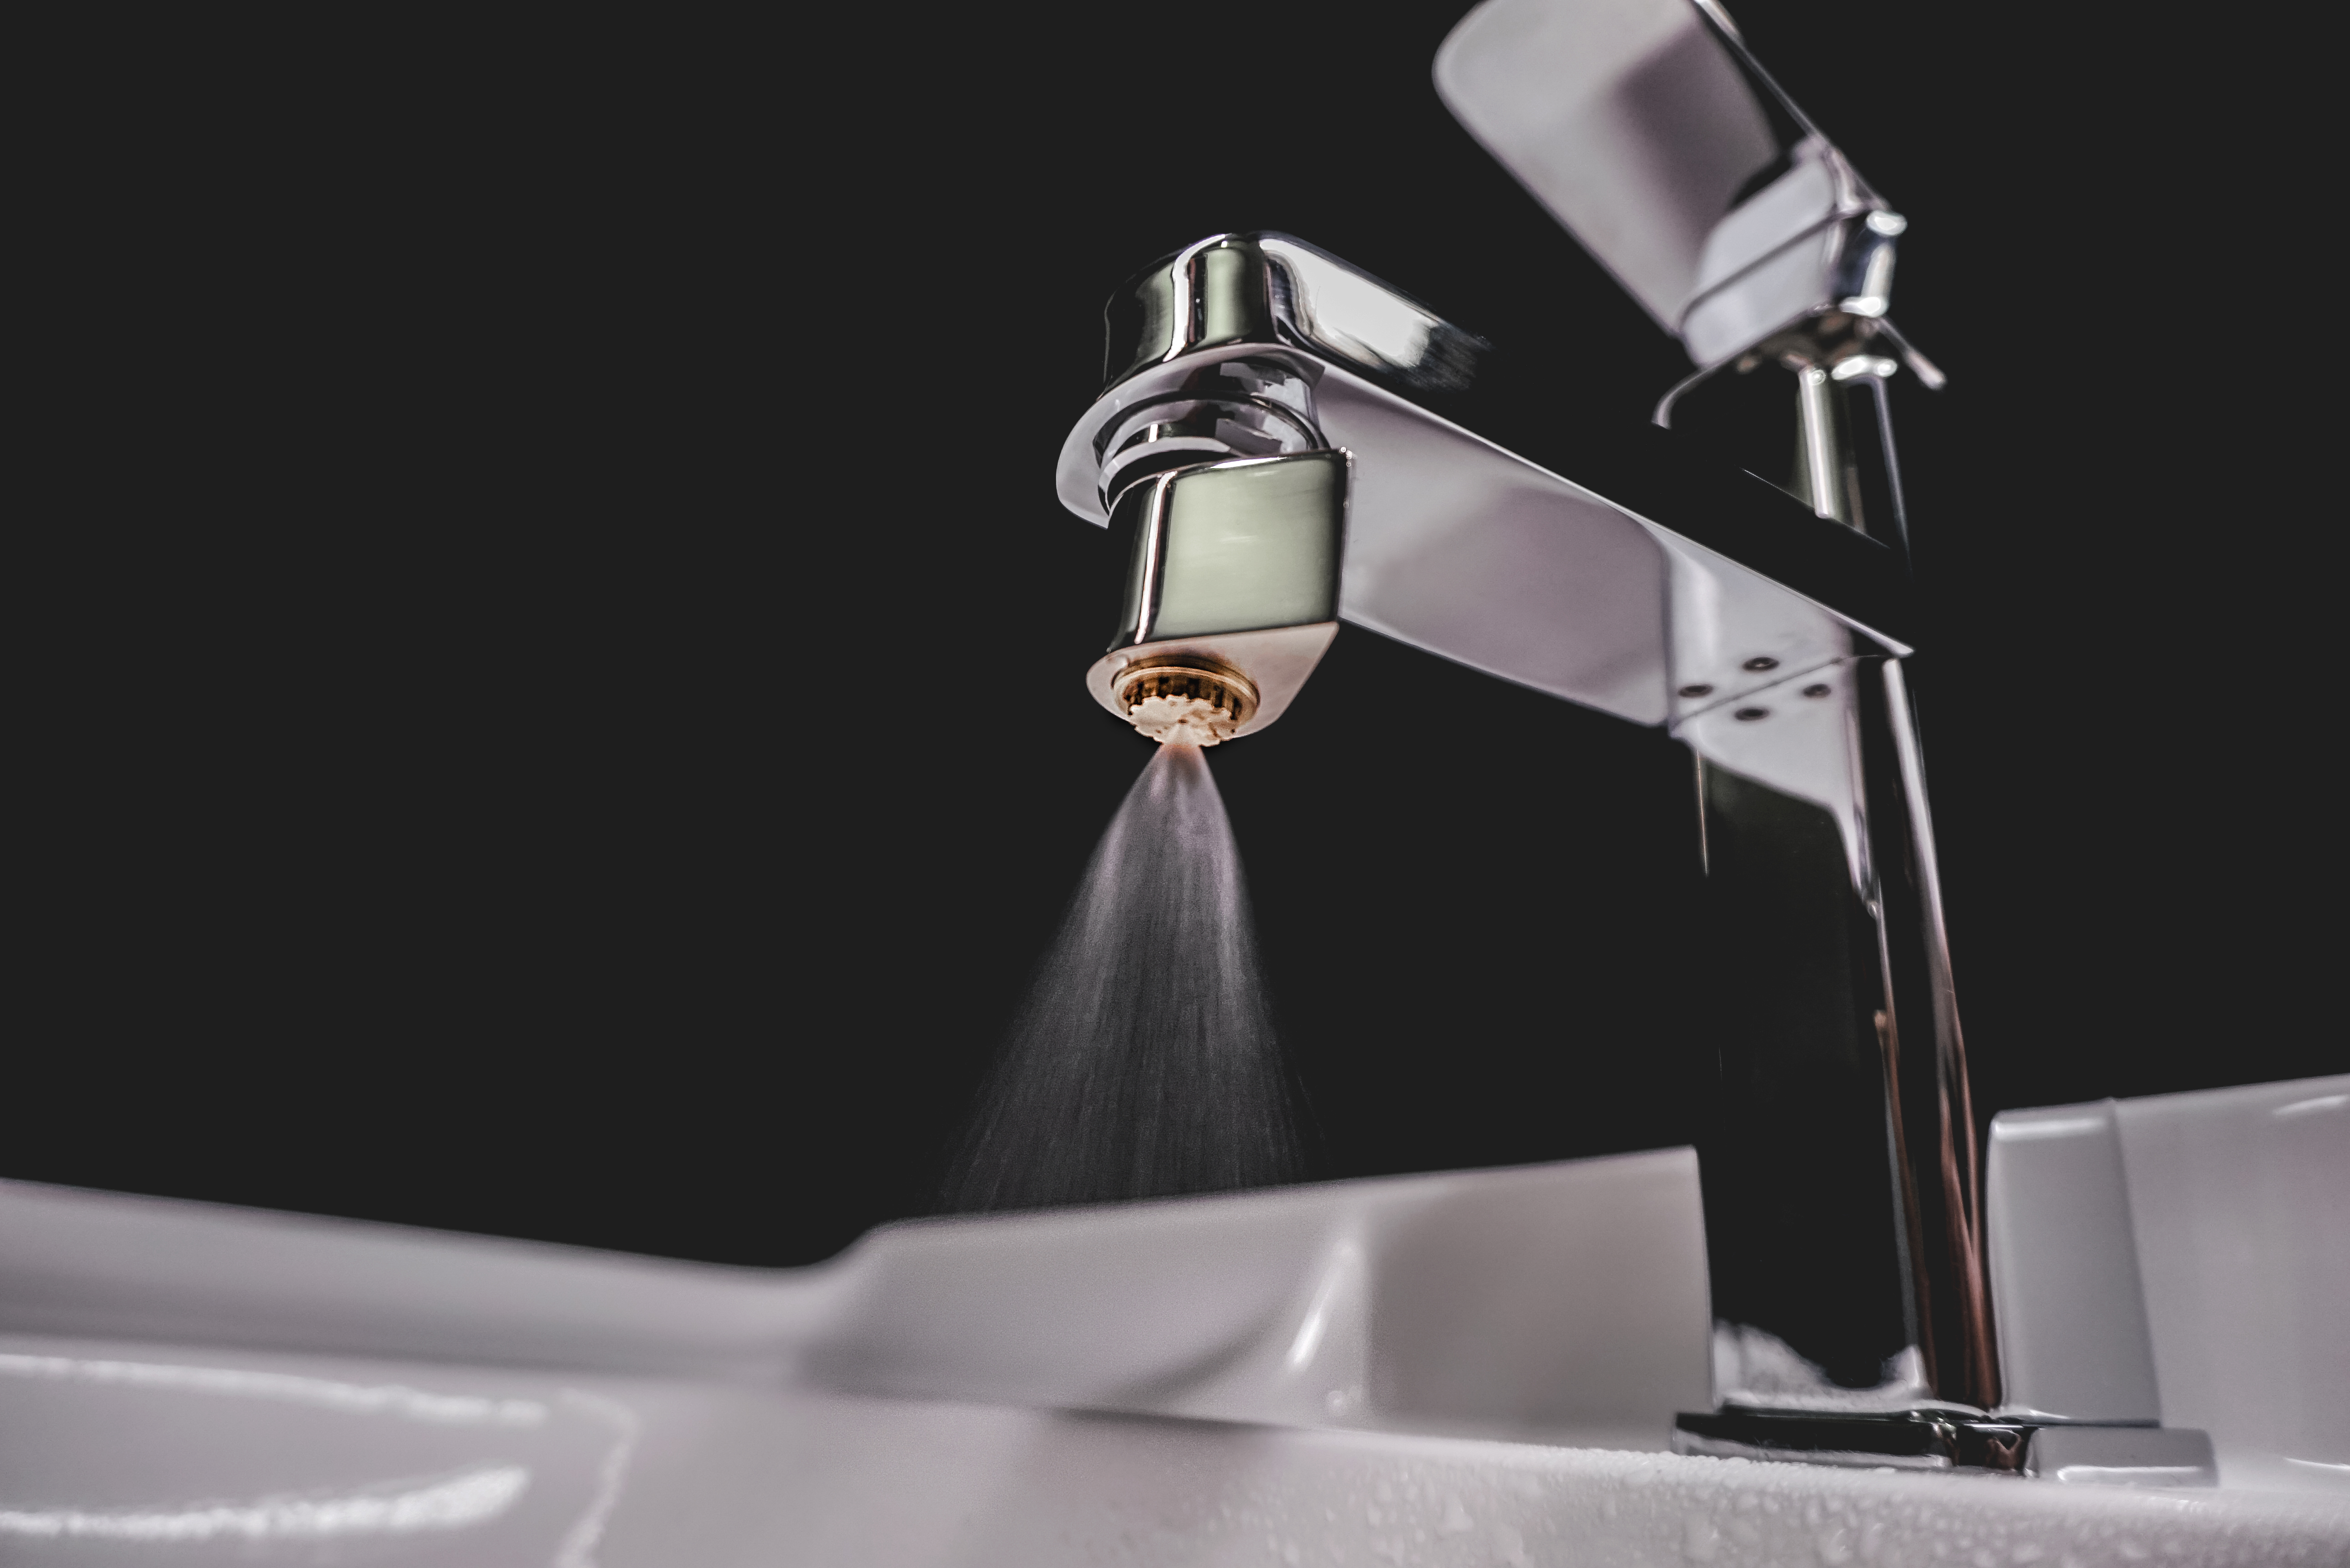
Aabshar nozzle producing an optimized spray from a tap
Water-saving nozzle photographed in Aabshar’s product studio

ONE TAP · ONE MINUTE

STANDARD FLOW6.31L
WITH AABSHAR0.64L
~90%less flow in the demonstration

Retrofitting an existing fixture makes the savings visible without replacing the full plumbing system.
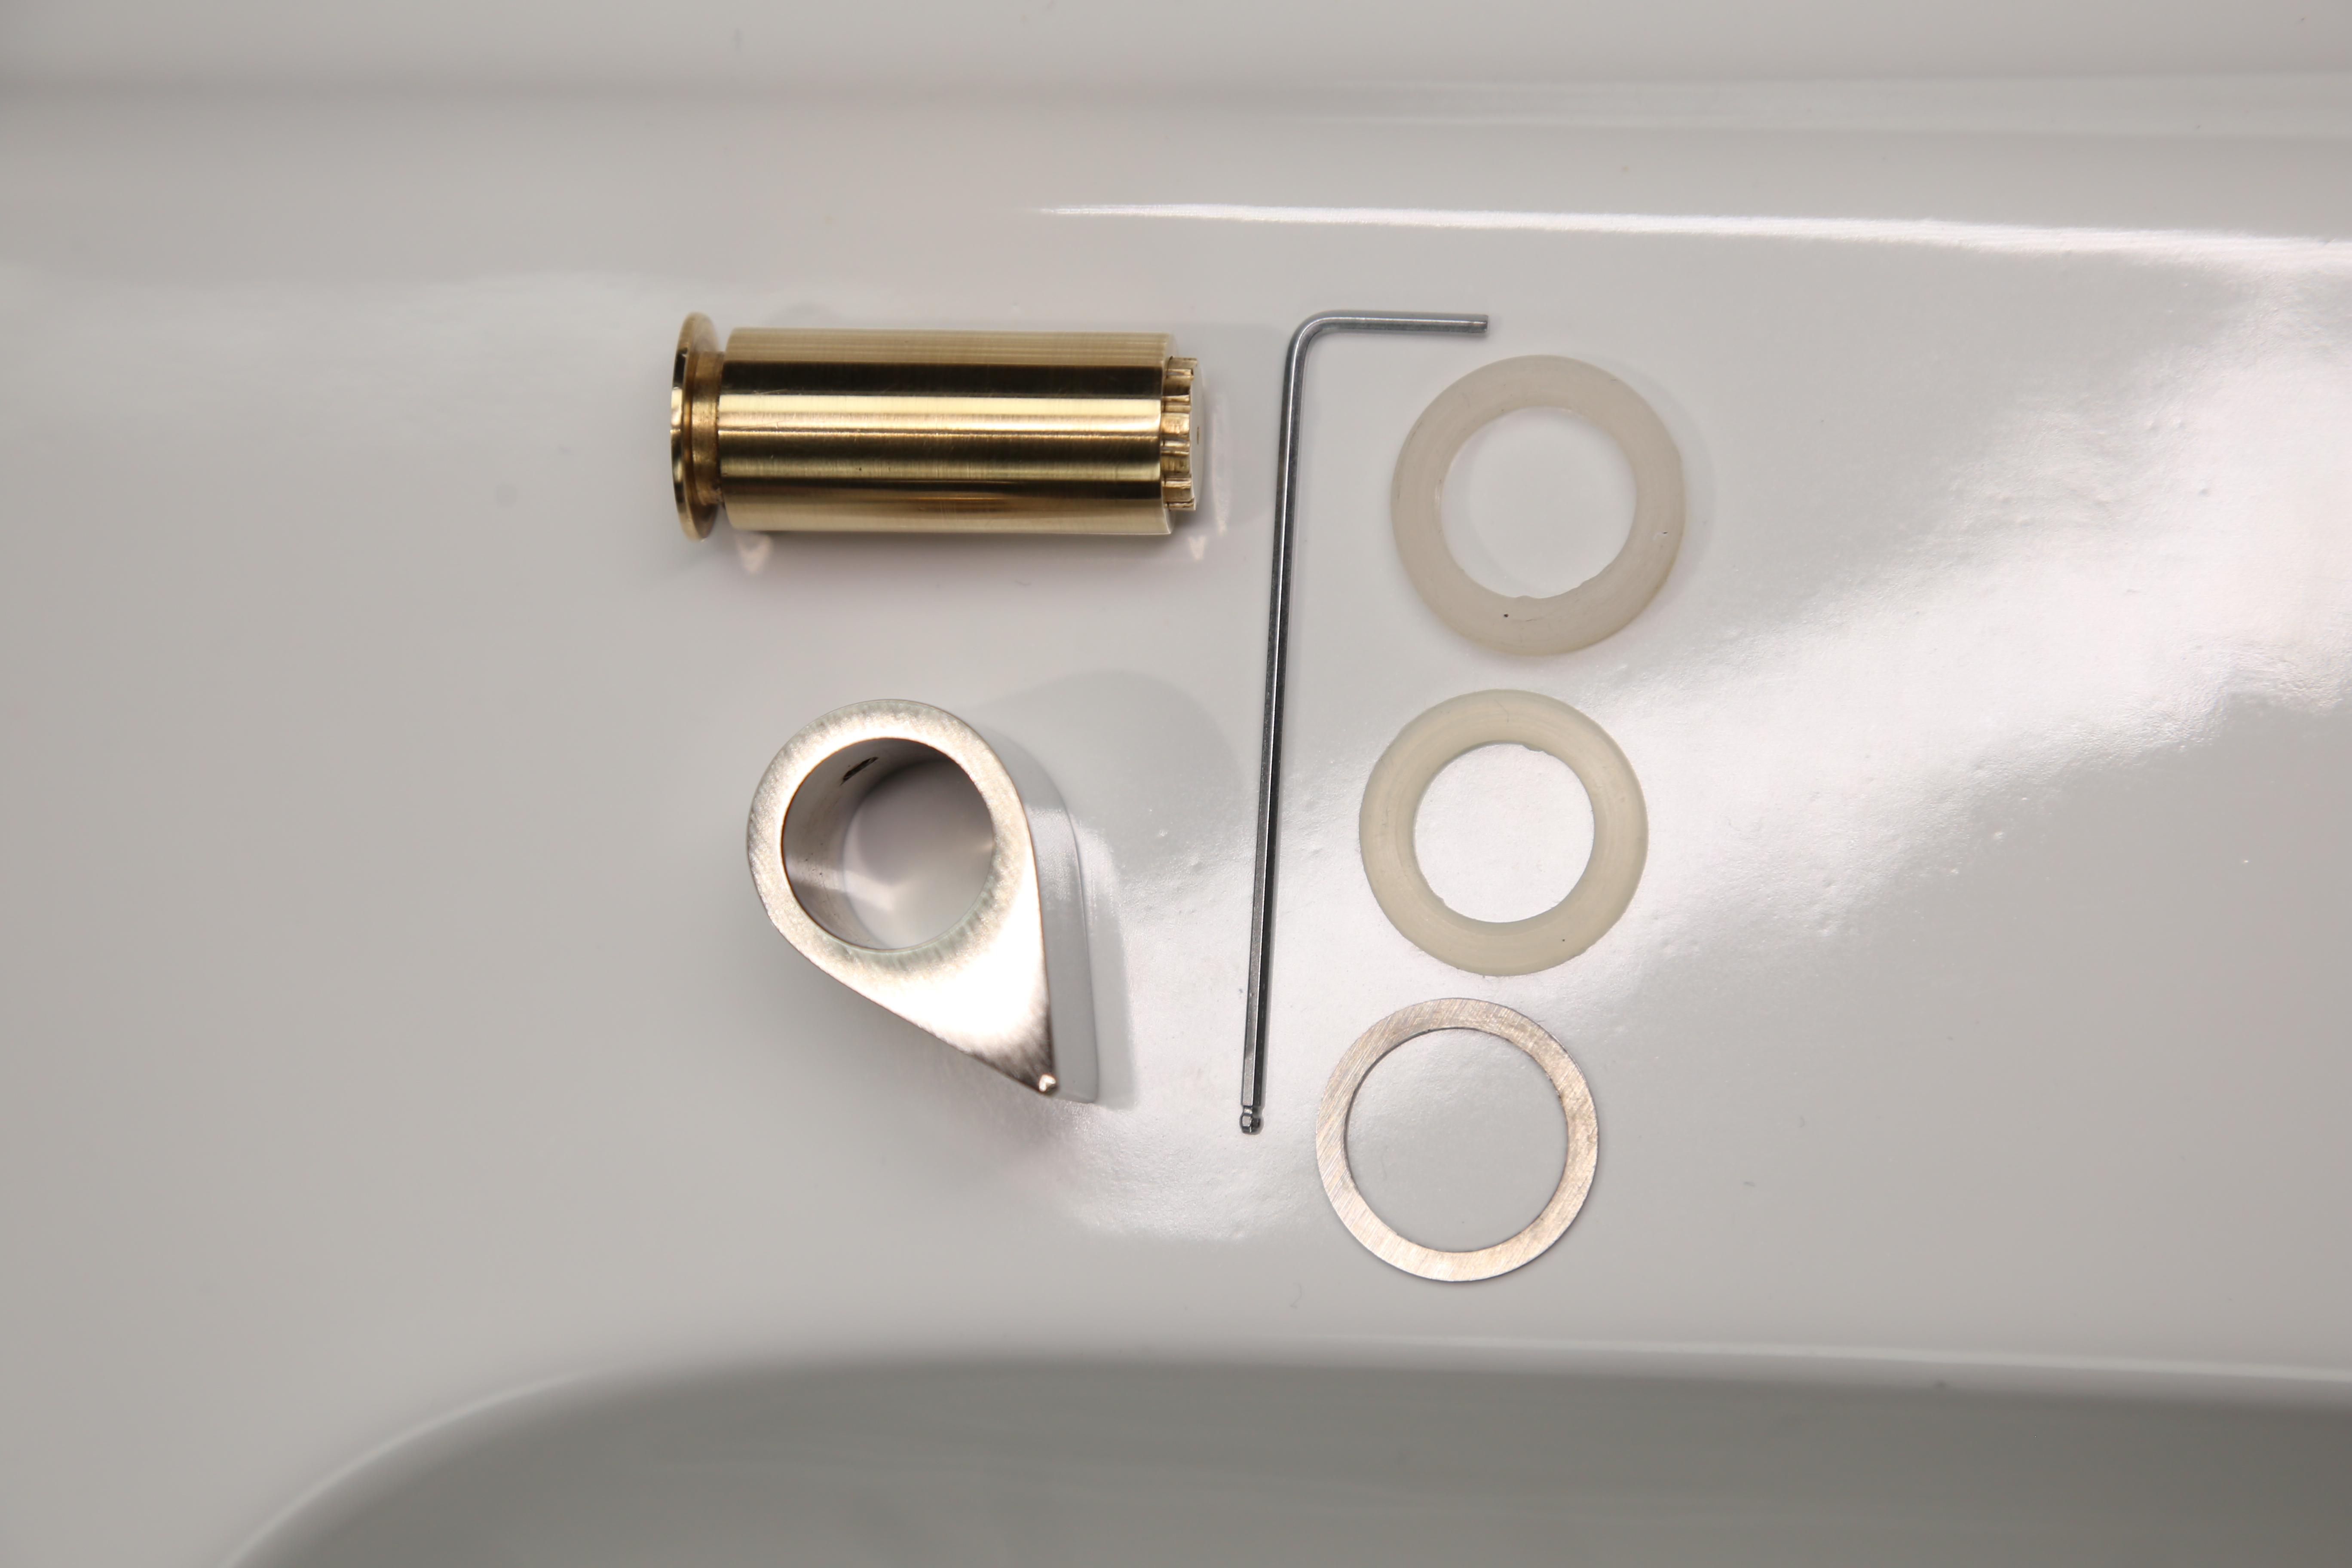
Aabshar water-saving nozzle components arranged for a product photograph

Engineered for existing taps. Site-wide results depend on usage, fixture mix and operating conditions; those are measured in the case studies that follow.

Aabshar one-minute flow demonstration, 2024. The 90% figure is a controlled tap result, not a building-wide savings rate.

WHY THIS PRODUCT FOR THIS REGION

Global flow devices exist. Local operating conditions matter.

Aabshar’s product positioning is more specific than a low-flow nozzle: savings at existing taps while handling the water quality and usage patterns encountered in its target markets.

Aabshar nozzle components designed for installation on existing taps
THE PRODUCT THESISFlow savings with impurity tolerance
01What Aabshar has shown

Its 2024 materials report an impurity-tolerant design and site savings in industrial and community settings.

02What regional buyers require

Water-saving devices must work at the fixture and meet local technical requirements. The GCC framework explicitly includes ablution taps and flow regulators.

03What to validate next

Independent flow, pressure, sediment and durability tests under target water conditions, followed by applicable Gulf conformity assessment.

EU EN 246European flow-regulator specification
GSO Gulf regulationIncludes ablution taps and aerators
Aabshar validationRegional test and certification pathway

Aabshar’s high-TDS/impurity-tolerance positioning comes from WQI v8 slides 27–28; no independent head-to-head result or Gulf certification is claimed. EU reference · GSO regulation

05 / Case studies

Reported site results extend beyond the tap demonstration.

HEAR FROM DEPLOYMENT SITESFour short videos on Aabshar’s channel
Customer voices · historical deployments

Company-reported before/after cases. Periods and site conditions differ; meter and invoice records support diligence.

GOOGLE SFSD · WATER IMPACT

4.33B litres modeled by 2024.

The Google SFSD workbook shows a modeled rise from 0.59B litres in 2021. Historical unit counts feed one per-unit saving formula; site-meter validation is still needed.

20210.59B
20222.69B
20233.73B
20244.33B
6,124 → 44,804unit-count inputs, 2021 → 2024
96.624 m³modeled saving per unit-year
4.33B L44,804 × 96.624 m³ × 1,000

Source: Google Startups for Sustainable Development impact workbook, “Impact Metrics” tab. Historical unit counts are company inputs; the water volumes are modeled, not independently audited site-meter totals. The 96.624 m³ assumption uses a 12.2 L/min flow delta for 30 minutes/day and 264 days/year.

07 / Customer history

200+ organizations in Aabshar’s customer history.

Aabshar reports serving more than 200 organizations. Selected customer marks show the breadth of its 2024 commercial footprint.

200+clients served, per founderSelected 2024 customer marks.

2024 COMPANY-REPORTED TRACTION

Early sales, usage and demand signals.

Aabshar reported these results in 2024. Letters of intent are expressions of interest, not contracted revenue.

$440K+sales reported in 2024
$11.2Mletters of intent reported in 2024
55K+users reported in 2024
2reported acquisition approaches
The audited record separately shows FY2023 net revenue of PKR 36.50M. These figures are historical; current operating results should be assessed separately.

Aabshar company presentation, 2024. LOIs are not contracts.

THE SECOND PLATFORM OPPORTUNITY

AQI made air legible. Community centers can seed a local WQI view.

Aabshar plans to collect quality readings at equipped community centers across city neighborhoods. Verified center data could then form a local, use-specific index and, as coverage expands, a wider network.

THE FAMILIAR EXPERIENCEAQIA local signal people can look up and understand.
AABSHAR’S PROPOSED DATA LAYERWQICommunity-center nodes, verified readings and use-specific guidance.
01 · COLLECTSensors at equipped community centers
02 · VERIFYCalibration, context and targeted lab checks
03 · INTERPRETNeighborhood views after supply-zone checks
04 · SERVECity and regional WQI data services
<3%of reported global quality data points came from the poorest half of countries, UNEP 2024
$8.6B2030 monitoring-systems forecast; adjacent category spend, not Aabshar’s data TAM

Real-time monitoring exists: USGS and US EPA. Aabshar’s proposed path runs from community-center readings to local and eventually wider WQI views. A center reading cannot represent every home until water-source and supply-zone differences are validated. Data-gap source: UNEP. Market proxy: Grand View Research.

COMMUNITY-CENTER WQI · ILLUSTRATIVE WORLD VIEW

Community centers can power a world WQI map.

The 216 / 411 / 657 scores are illustrative community-center nodes. Validated local readings could grow into city views and a global data layer; none of these map points is live coverage.

Illustrative world map for a future water-quality index, with sample community-center data nodes
COMMUNITY CENTERS → CITY WQI → WORLD DATA
ILLUSTRATIVE WORLD VIEW · NO LIVE COVERAGE216 WQI+Very hard water example: more soap use, residue and possible hair breakage.
216

Hair and washing

>180 mg/L hardness as CaCO₃ is “very hard” water. It uses more soap. A small hair-fiber study found more breakage; a score cannot predict baldness.

USGS · HAIR-FIBER STUDY
411

Skin-contact alert

>200 mg/L hardness as CaCO₃ is an example for review. Hard-water washing can leave cleanser residue and irritate susceptible skin. This is not a rash diagnosis.

J INVEST DERMATOL · UK BIOBANK
657

Building-water check

25–45°C can favor Legionella growth if controls fail. Check residual and sample the system; a score cannot detect bacteria.

CDC WATER MANAGEMENT

216 / 411 / 657 are illustrative Aabshar interface scores, not validated health thresholds or measurements at these centers. Sources: USGS hardness classes, hair-fiber experiment, skin-irritation experiment, eczema association, CDC building-water guidance. Map markers and highlighted regions are illustrative, not current Aabshar coverage. City and world views require mapped supply zones and validated sampling.

CONNECTED WATER · PRODUCT PATH

Community centers become a WQI data network.

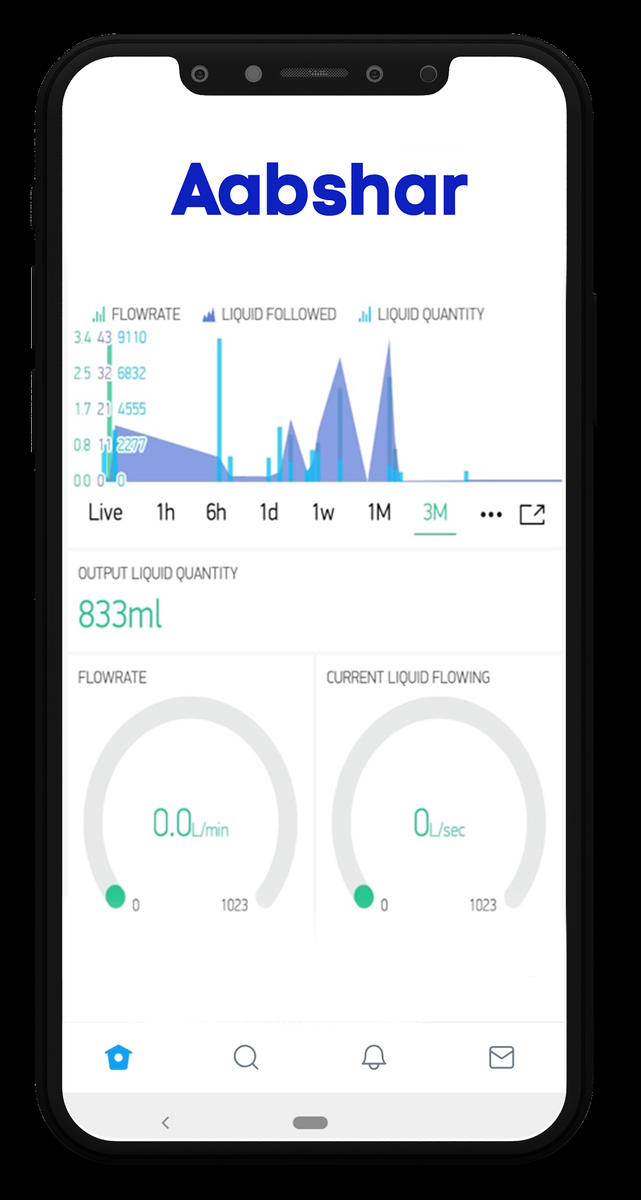
The 2024 flow prototype proved data capture. Calibrated center readings, site context and data rights are the next steps toward a useful local WQI view.

aabshar / connected waterILLUSTRATIVE INTERFACE
PROPOSED WQI NETWORK

Local water-use intelligence

NO LIVE READINGS
01SenseReadings at equipped community centers
02VerifyCalibration, context and lab confirmation
03InformOperator alerts and useful local indices
C1C2C3C4

Community centers seed the network. Verified, time-stamped readings can support city views once supply zones and data quality are established.
01
Start with a physical result

Use the retrofit to lower water flow at a fixture.

02
Prove savings at the site

Record baselines, usage and follow-up readings.

03
Start WQI pilots now

Validate sensors and sampling at community centers, then prove the first paying data use cases.

The flow numbers come from Aabshar’s one-minute demonstration. The WQI interface is illustrative. It shows no live quality readings or current city coverage.

10 / Go to market

One core retrofit. Several customer settings.

Aabshar tested the retrofit across seven settings. Select a sector and adjust equipped taps to explore site-level water-saving potential.

Calculated from the SFSD workbook’s 96,624 L estimated saving per equipped tap-year. Tap counts here are adjustable examples, not measured sector averages.

11 / Business model

Hardware, service and future data revenue.

Historical

Product sale

One-time revenue from the water-saving retrofit. Pricing depends on channel and volume.

TESTED · READY TO EXPAND

Hardware as a Service

Tested at multiple mosques. Direct donations to Aabshar have supported deployments; the recurring payer and service terms are the next commercial proof.

Future hypothesis

WQI data licensing

Potential data or analytics contracts after sensor coverage and credible quality data are established.

FIRST EXPANSION WEDGEPartner-led mosque portfolios

Bring a named cohort of sites with fixture and bill access. Mosque operators, sponsors or CSR partners can fund deployment; prove which payment structure repeats. The NGO channel is still in process.

The $50/month site fee used in scenarios is a historical pricing assumption, not current contracted revenue. WQI data buyers remain to be validated.

CUSTOMER REPORTING VALUE

Savings can become evidence for impact and building standards.

SDG ALIGNMENT

Water, energy and climate

SDG 6.4Water-use efficiency and scarcity
SDG 6.3Water quality, when measured by validated sensors
SDG 7 & 13Related energy and CO₂ estimates, with transparent assumptions

Aabshar modeled 2024 water and CO₂ outcomes. Project reporting is strongest with measured site baselines and follow-up readings.

PROJECT CERTIFICATION SUPPORT

Documentation for recognized frameworks

LEEDEDGEBREEAMWELL

Lower fixture flow and measured baselines can support a project's water-efficiency documentation. Validated quality testing could support relevant WELL Water requirements.

Certification is assessed at building or project level. Aabshar can contribute water-efficiency evidence; the product alone does not certify a site.

UN SDG 6 · USGBC LEED · EDGE · BREEAM Wat 01 · WELL Water

CARBON · MEASUREMENT BEFORE MONETIZATION

Water savings can become a climate asset when the evidence qualifies.

Japan’s Kyoto record shows that verified credits can matter to a national buyer. Aabshar has a modeled emissions outcome, but no issued credits. The investable work is to verify energy effects, ownership and an eligible pathway.

JAPAN · KYOTO COMPLIANCE141.8MCERs retired for 2008–12 compliance. Their origin is not established here as water saving.
MONETIZATION PRECEDENT · 2025$1.99BTesla regulatory-credit revenue, 2.1% of total; a different regulatory mechanism.
AABSHAR 2024 INTERNAL MODEL11,039 testimated CO₂e avoided at 5 kWh/m³ and 0.51 kgCO₂/kWh; zero credits issued.
ILLUSTRATIVE CREDIT SENSITIVITY

What could eligible volume be worth?

18.5× modeled volume is roughly the 80B-litre 2030 ambition divided by the 2024 model. The periods and site mix must be comparable for that extrapolation.

HYPOTHETICAL GROSS VALUE$2.55M204,222 modeled tonnes × 50% × $25/t
Today: 0 issued credits

Measured energy baseline → additionality and ownership → active methodology → third-party validation and issuance.

The SFSD workbook assumes 5 kWh of avoided energy per m³ saved and a 0.51 kgCO₂/kWh grid factor. This 5 kWh/m³ rate is not verified for Aabshar’s site mix. All values are sensitivities, not a forecast, current asset or annual recurring revenue. Japan Ministry of Environment · UNFCCC Kyoto account · Tesla 2025 10-K · Verra method status.

12 / Financial record

Historical audited revenue doubled in FY2023.

Audited FY2022 and FY2023 results, PKR millions. Current financial results should be reviewed separately.

FY2022FY2023Net revenue
18.15
36.50
Gross profit
8.87
17.86
Net result
+0.19
−21.06

FY2023 gross margin: 48.9%. The FY2023 loss reflects the cost base of the prior growth phase. Current cost structure requires updated management accounts.

Source: Aabshar auditors' report for the year ended 30 June 2023, statement of profit and loss. PKR values rounded from audited rupee figures.

ANNUAL RECURRING REVENUE · SCENARIO

Two revenue engines can add up to $100M.

Start with the arithmetic. Then change the assumptions to see which customer scale and price would be required.

WATER-EFFICIENCY SERVICE$60M100,000 sites × $50/month × 12
+
FUTURE WQI DATA LICENSES$40M400 contracts × $100K/year
=
COMBINED SCENARIO$100Millustrative ARR, not a forecast
Change the four assumptions

Top-line sensitivity only: Aabshar has no live WQI data contracts. This blended scenario is an alternative to, not an addition to, the prayer-site scenario. Site acquisition, installation cost, churn and data validation are excluded.

MOSQUE CHANNEL · INDEPENDENT SITE COUNTS

A sourced path to $100M turns on which sites qualify.

TEN-COUNTRY MIDDLE EAST CORE~401K mosques5% × $50/month × 12 = $12.02M ARR
EXPANDED UPSIDE · PAKISTAN + INDONESIA + TEN MIDDLE EAST MARKETS~1.73M prayer sites10% × $50/month × 12 = $104.06M ARR

>500KPublished regional breadth across 13 selected markets
The calculator uses a ten-country ~401K core. Yemen, Syria and Iraq have additional reported counts from mixed years, but active and reachable sites are unverified. See the omitted-country evidence ↗
The wider pool also includes 393,064 registered Indonesian mushalla; site suitability and payer need validation.

Test the site pool

Choose payment structure
ILLUSTRATIVE SUBSCRIPTION ARR$52.03M1,734,405 sites × 5% × $50/month × 12

One-time donations fund deployment; they do not create ARR.

See sources, site definitions and the $100M threshold

Pakistan mosques 622,705
Indonesia mosques 317,882
Indonesia mushalla 393,064
Ten Middle East markets ~400,754

Ten selected regional markets · inputs behind 400,754

These are mixed-year counts, estimates, floors and program subsets. The sum is a scenario denominator, not an exact Middle East mosque total.

Egypt≈121,5002025 · reported / derivedMinister via Al-Ahram ↗
Türkiye90,000 floor2025 · official floorDiyanet ↗
Saudi Arabia78,0942024 · official countGASTAT ↗
Iran75,000 floor2026 · reported floorOfficial quoted by Tasnim ↗
Oman17,6572026 · official subsetMARA dashboard ↗
Jordan7,6502024 · official planJordan Awqaf budget ↗
UAE5,3702026 · official subsetUAE Awqaf initiative ↗
Qatar≈2,3002024 · official reportQatar News Agency ↗
Kuwait≈1,828Jul 2024 · secondaryTorathona ↗
Bahrain1,3552024 · secondaryAl Watan ↗
See definitions and calculation in the appendix →

Why the region is bigger than the calculator base

Yemen75K reported in 2014; a 2026 authority claim exceeds 100K. Conflict and site operation need checking.2014 minister report ↗
Syria>16K in 2026, including ~1.5K damaged mosques.Minister via SANA ↗
Iraq>15K Sunni endowment mosques reported in 2017; other endowments and current operability not counted.Waqf official interview ↗

These published figures put the historical/reported breadth of 13 markets above 500K. They are excluded from ARR calculations because dates, damage and access differ.

Middle East is an indicative subtotal across mixed years and definitions. Indonesia's ministry registry changes over time. Bangladesh and several Middle East countries are not included in this broader pool.

The earlier 3.6M MENA-PIB × 5% × $50/month = $108M scenario remains a historical company assumption; a matching country-level base was not found.

Pakistan Bureau of Statistics · Indonesia Ministry of Religious Affairs · ten-country source table. These are site counts, not a reachable buyer list; $50/month and adoption are scenarios.

THE 2030 PATH · GOALS WITH PROOF GATES

Aabshar’s 2030 ambition connects savings, WQI data and repeatable revenue.

NOW → 2030One installed footprint.
Two connected businesses.

Scale verified water-efficiency service while building a quality-checked, use-specific WQI network. Each stage has a measurable gate before the next.

WATER IMPACT AMBITION80BLcompany target by 2030
REVENUE AMBITION$120Mcompany ARR target by 2030
012026 · NOWProve the next cohort

Expand tested mosque HAAS. Start WQI sensor specification and calibrated pilots at community centers. Record payer, baseline, installation cost and data rights.

022027Repeat the playbook

Show water and bill results, uptime, renewal and service margin. Validate WQI parameters against targeted sampling.

032028–29Connect portfolios

Extend across customer verticals and regions. Prove WQI buyer demand, use-specific indices and data QA at scale.

042030 · TARGETReport achieved scale

Separate measured water impact, contracted ARR, live WQI coverage and any verified climate outcome from ambition.

The 80B-litre and $120M goals come from Aabshar’s earlier deck. The year-by-year steps are a proposed sequence, not historical achievements or a financial forecast. WQI work starts now; no live WQI network or issued carbon credits are claimed.

THIRD-PARTY SIGNALS · HISTORICAL RECORD

Recognition from global networks and industry bodies.

McKinsey & CompanyFeatured in a climate e-bookMcKinsey & Company recognitionEO GSEAGlobal Lessons from the Edge awardAli Khursheed · 2020 GSEA final


YPOBest Entrepreneur AwardYPO · 2022 founder record

P@SHA6 reported awardsTwo each year, 2024–2026; categories to reconcile with certificates
103feature and appearance entries; 97 distinct titles in Aabshar’s register
50+award, fellowship, program and grant entries; categories overlap
TechstarsTechstars WaterTech & Sustainability 2024; Google Startups for Sustainable Development selection, per founder record.
Watch three public endorsements ↗

These videos are published on Aabshar’s channel; views expressed are attributed to their speakers.

EXPLORE THE FULL REGISTER

Find the evidence behind the marks

McKinsey feature and YPO award descriptions follow Aabshar’s historical records; EO GSEA’s global award has an independent event report. The Techstars cohort is documented. Register counts describe entries, not all unique wins or articles.

FOUNDER BACKING

People and institutions have backed the founders.

Four named early investors and several institutional relationships supported Aabshar’s first growth phase.


INVESTMENT AND ACCELERATION
TechstarsSarmayacarEastern Garments
GRANT RELATIONSHIP
USAID
View the 2024 advisory board
Andreas DankelmannLogistics entrepreneur
Faisal SherjanStartup and industry leader
Dan AbbateFounder and operator
Hassan AltafShakarganj
Khurram SaleemUnze London
Shahid HassanAl Jalil Developers
Yaser AwanMindstorm
Ammar ZaeemRevolving Games

Advisory roster shown as of 2024; current participation may differ.

Early investor and support record, 2024. USAID was a grant relationship; a current cap table can be shared in diligence.

LEADERSHIP EXPERIENCE

Experience across product, manufacturing and commercial growth.

The leadership roster that built Aabshar’s first product and customer base brought manufacturing, IoT, AI, commercial and brand experience.

Leadership and affiliations shown as of 2024; current operating roles may differ.

THE FOUNDER’S REASON

Water scarcity became personal before it became a company.

Ali Khursheed recounts spending eight months in a hospital bed. Together with the water shortages he witnessed in communities, that experience gave him a personal reason to build Aabshar.

Design principle: save water where people use it and show evidence that it worked.

Ali Khursheed’s founder account, 2026.

Ali Khursheed, founder of AabsharALI KHURSHEED · FOUNDER & CEO

18 / The next conversation

Partners and capital for the next deployment cohort.

01

Site access

NGO and portfolio partners with facilities that can be measured and served.

02

Pilot sponsors

Fund expansion of the tested model with clear savings and service economics.

03

Early investors

Back a measured HAAS rollout and the staged development of WQI data services.

Aabshar seeks introductions to site owners, deployment sponsors and investors who can accelerate a measured expansion.

Research and source notes

What supports the numbers.

  1. UNESCO World Water Development Report 2026 — about $300B current annual investment and a $700B annual gap toward water security by 2030.
  2. BCC Research 2025 — $43.7B global smart-water management forecast for 2030; a broad market, not Aabshar TAM.
  3. Grand View Research — $8.6B global water-quality monitoring systems forecast for 2030; overlapping subset of the smart-water market.
  4. WRI Aqueduct 2023 — 83% of MENA population exposed to extremely high water stress.
  5. UNESCO World Water Development Report 2024 — roughly half the world experiences severe water scarcity for part of the year.
  6. UNEP 2024 — poorest half of countries contribute under 3% of water-quality data points.
  7. Aabshar WQI v8 presentation (2024) — product demonstration, seven verticals, client and award logos, historical price concepts and WQI prototype.
  8. Aabshar Techstars demo-day recording and PDF (2024) — 2024 presentation and company story.
  9. Aabshar audited FY2023 report — audited FY2022/FY2023 P&L.
  10. Aabshar Baitussalam mosque case and impact statement — historical site comparison and 34 nozzles.
  11. Aabshar Save Pakistan V21.0 — Saylani and Dawat-e-Islami cases.
  12. Aabshar Google SFSD Impact Assessment — historical unit-count inputs, modeled water volumes and per-unit assumptions.
  13. Saudi statistics, Türkiye Diyanet, Oman ministry, Egypt minister statement, Jordan budget, UAE Awqaf, Qatar news agency, Kuwait reporting, Bahrain reporting — ten-country mosque pool.
  14. P@SHA winners — 2024 and 2025 Gold results; 2026 AI Gold also appears in a P@SHA Awards LinkedIn announcement.
  15. GSO Gulf water-conservation regulation — includes ablution taps and flow-rate regulators; product conformity is not established here.
  16. European Commission JRC standards review — EN 246 covers sanitary flow regulators.
  17. Verra VMR0005 — previous low-flow-device carbon methodology is inactive; any credit pathway needs a current eligible standard.
  18. USGS real-time water quality and US EPA online monitoring — existing networks; Aabshar’s proposed index focuses on everyday point-of-use data.
  19. USGS water hardness and CDC building-water management — effects and operating controls for washing, cleaning and showers.
  20. Japan Ministry of Environment Kyoto results and UNFCCC Japan accounting — national Kyoto compliance and CER retirement; no water-project attribution. Japan water-saving guidance — hot-water showerhead CO₂ example.
  21. World Bank carbon pricing 2026, Tesla 2025 10-K, and Verra status — context and limits for the carbon sensitivity.
  22. Aabshar video channel — company-hosted case testimonials, product demonstrations and endorsements linked at their relevant slides.

Earlier company market estimates and revenue targets are presented as hypotheses or ambitions, not verified operating results. The 13% × 500,000 mosques × $50/month equation equals $39M/year, rather than $300M/year. Future financial results require current operating data and validated prices.